The Greater Vancouver Exterior Painting Almanac
A yearly weather reference for exterior painting in Greater Vancouver: dry-day calendars, city-by-city microclimates, overnight temperature rules, and how global warming is stretching summer while making autumn riskier.
Posted on August 30, 2026 by The Vancouver Painters Team
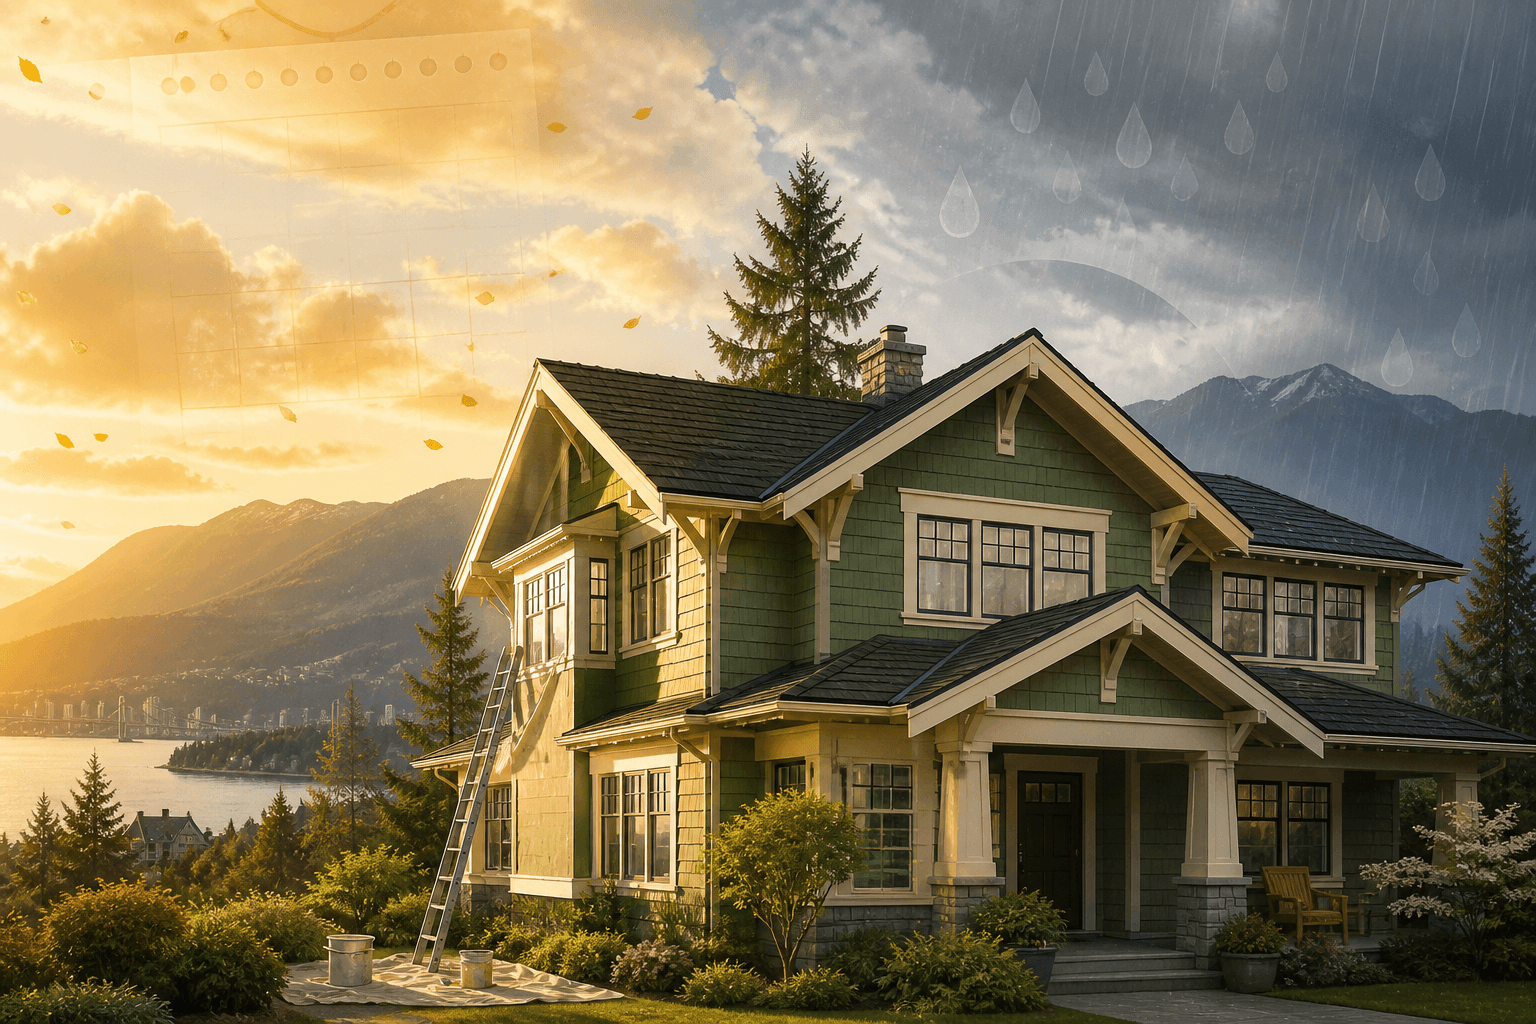
Quick answer: In a typical year the reliable exterior-painting season in Greater Vancouver runs May–September (late May through mid-September in practice), with July and August as the peak. At Vancouver International Airport, those two months average only about six wet days each and nearly every night stays above 10°C. Book earlier if you live on the North Shore, later if you live in South Surrey or the Fraser Valley, and treat October as a bonus — not a promise.
At a glance
The year in five facts
Read this box, pick your city below, then keep scrolling for the sourced tables.
Best season
May–September
Late May through mid-September in practice.
Peak months
July and August
About 25 dry days and 31 overnight-safe nights at YVR.
Airport year
1,159.5 mm
169.5 days with measurable rain. November is the hinge.
The paint rule
10°C nights
Plus a 24-hour dry window after the coat.
What warming does
Sharper contrast
Longer, hotter summers. Meaner, wetter autumns.
Figures are Vancouver International Airport normals for 1991–2020 unless a city section says otherwise.
This is the piece we wanted on the fridge. Not a “best time to paint” tip, and not a sales pitch dressed as weather. It is a climate almanac for people who need to decide, every spring, whether the house can wait one more winter.
The numbers below come from Environment and Climate Change Canada’s 1991–2020 climate normals, from Metro Vancouver and the Pacific Climate Impacts Consortium projections, and from the same physical rules paint manufacturers print on the can. We will tell you exactly which station each figure belongs to. Vancouver is a city of microclimates. Pretending otherwise is how a North Vancouver fascia job ends up in November.
For a shorter month-by-month booking guide, start with the best time to paint an exterior in Vancouver. Come back here when you want the why.
Your year at a glance
Where is the house?
Tap a place. The calendar changes to that climate — large enough to read from across the kitchen.
Downtown and the north side of the city sit in a wetter pocket than Richmond. July and August are still the peak, but March and October close faster than the airport calendar suggests.
Vancouver and nearby waterfront neighbourhoods. About 378 mm wetter than the airport each year. Peak months: July and August.
Station: Vancouver Harbour. 1991–2020 normals. Wetter than the airport by about a third.
The painting year
- JanClosed237 mmJanuary: Closed, 236.6 millimetres of precipitation
- FebShoulder117 mmFebruary: Shoulder, 117 millimetres of precipitation
- MarClosed163 mmMarch: Closed, 162.5 millimetres of precipitation
- AprShoulder118 mmApril: Shoulder, 117.7 millimetres of precipitation
- MayGood start73 mmMay: Good start, 72.6 millimetres of precipitation
- JunExcellent66 mmJune: Excellent, 65.7 millimetres of precipitation
- JulPeak44 mmJuly: Peak, 43.5 millimetres of precipitation
- AugPeak49 mmAugust: Peak, 48.6 millimetres of precipitation
- SepGood start71 mmSeptember: Good start, 71.4 millimetres of precipitation
- OctClosed157 mmOctober: Closed, 156.8 millimetres of precipitation
- NovClosed245 mmNovember: Closed, 245.2 millimetres of precipitation
- DecClosed200 mmDecember: Closed, 199.9 millimetres of precipitation
Rain through the year
Taller bars mean a wetter month. July should look like a puddle. November should look like a wall.
Read the Vancouver notes — the sourced tables stay on this page for search and citation.
How to use this almanac every year
Climate normals are a tide table. They tell you the shape of the year, not Tuesday’s weather.
- Pick your city in the calendar above. That is the human version of the tables.
- Read the Paint Window Score if you want the airport numbers journalists cite.
- Check this year’s forecast against the overnight-low and rain-free rules in the science section.
- If the coating is already failing, do not wait for a perfect July. See whether to paint before the rainy season.
We will update this page when Environment Canada publishes the next normals decade, or sooner if a season rewrites the story.
The Vancouver paradox
The City of Vancouver’s weather is not Greater Vancouver’s weather.
Outsiders think it rains here all the time. Locals know a more interesting fact: July at the airport is one of the driest midsummer months in Canada, and then the sky remembers itself.
At Vancouver International Airport in Richmond — Climate ID 1108447, the official long-record station for the region — the 1991–2020 normals give:
- 1,159.5 mm of precipitation a year
- 169.5 days with at least 0.2 mm of precipitation
- 34.1 mm in July and 36.1 mm in August
- 174.6 mm in November, the wettest month
That is not a gentle fade from summer into fall. It is a hinge. July averages 6.2 days with measurable rain. November averages 19.6. In forty-five days the coast goes from “pack a picnic” to “pack a second raincoat.”
The other half of the paradox is that Vancouver Harbour, six kilometres north of the airport, records 1,537.4 mm a year. West Vancouver records 1,963.6 mm. A rain gauge at the foot of Grouse Mountain in North Vancouver has historically collected more than 2,500 mm. Same metropolitan area. More than a doubling of rain.
What paint actually needs
Paint does not care about the calendar. It cares about four conditions at once.
Temperature. Most standard exterior acrylics want air and surface temperatures at or above 10°C (50°F) while the film forms. Many modern “low-temperature” acrylics are rated to about 1.7°C (35°F), but only if the surface itself is that warm and stays that warm for a day or two. A 9°C afternoon that falls to 4°C overnight is not a 9°C painting day.
Dew point. Manufacturers ask that the surface sit at least about 3°C (5°F) above the dew point during application and early cure. That is why a “dry” October morning on a north wall can still be a bad morning: the siding is wet with dew even though the radar is green.
Humidity. Afternoon relative humidity at the airport averages 61–62% in July and August and 76–82% from October through January. High humidity slows coalescence. It does not always forbid painting, but it stretches dry and recoat times and makes a surprise shower more dangerous.
A rain-free window after the coat. Product sheets vary from “a few hours” to “do not paint if rain is expected.” In this climate, treat a clean 24-hour forecast as the adult standard for a full exterior, and longer if you have just washed the house. Washing and painting are not the same afternoon. Our pressure-washing guide is the companion to this one.
The quiet killer in the Lower Mainland is not noon rain. It is overnight. At the airport, July nights drop below 10°C on almost no days (about 30.6 nights stay above 10°C). October nights stay above 10°C on only about 4.8 days. That is why a warm, bright Thanksgiving weekend can still be a poor time to paint a shaded wall.
The Paint Window Score
We built a simple score so a homeowner, an editor, or a strata manager can see the year at a glance. It uses Vancouver International Airport normals for 1991–2020.
- Dry days are days with less than 0.2 mm of precipitation (the official “trace” threshold).
- Warm days are days with a maximum above 10°C.
- Overnight-safe nights are days with a minimum above 10°C — the nights when a standard acrylic can keep forming a film.
- Afternoon humidity is relative humidity at 15:00 local time.
| Month | Precip (mm) | Dry days | Warm days | Overnight-safe nights | Afternoon RH | Window |
|---|---|---|---|---|---|---|
| January | 174.0 | 11 | 5 | 0 | 81% | Indoor season |
| February | 90.8 | 13 | 6 | 0 | 75% | Indoor season |
| March | 106.4 | 13 | 16 | 0 | 70% | Prep and quotes |
| April | 85.5 | 15 | 26 | 1 | 66% | Shoulder |
| May | 59.1 | 18 | 31 | 11 | 64% | Opens |
| June | 51.1 | 18 | 30 | 25 | 62% | Excellent |
| July | 34.1 | 25 | 31 | 31 | 61% | Peak |
| August | 36.1 | 25 | 31 | 31 | 62% | Peak |
| September | 51.9 | 21 | 30 | 22 | 68% | Excellent |
| October | 123.9 | 16 | 28 | 5 | 76% | Shoulder |
| November | 174.6 | 10 | 12 | 1 | 80% | Closed |
| December | 172.2 | 11 | 3 | 0 | 82% | Closed |
Dry-day counts are rounded from the official precipitation-day normals (31 minus 6.2 wet days in July, and so on). February uses a 28-day month.
July and August at YVR each give you about 25 dry days and 31 overnight-safe nights. October still gives you 28 days with a high above 10°C — and only about five nights that stay there.
The coast does not run out of daytime warmth in autumn. It runs out of nights.
Sunshine tells the same story. The airport averages 289.8 hours of sun in July and 56.5 hours in December. That is not a mood. That is working time on a ladder.
Month by month
January and February — the long soak
This is not an exterior-painting season. January averages 174.0 mm and 20 wet days. December is similar. Surfaces stay cold, shaded walls stay damp, and even a two-day clearing is usually a thaw between systems, not a cure window.
Use winter for interiors, for planning, and for walking the house after storms. Look at fascia, window trim, and the base of north walls. If paint is already peeling to bare wood, the question is protection, not cosmetics. How often a Vancouver house needs repainting depends more on those winter inspections than on the date of the last job.
March — quotes, not coatings
March feels hopeful. Cherry trees do that to people. Daily highs climb above 10°C on about 16 days, but overnight-safe nights are still essentially zero and 17.6 days are wet. March is for estimates, colour samples, strata paperwork, and booking a May or June start. South-facing, low-moisture trim can sometimes take an early coat. A full two-storey house cannot.
April — the false spring
April is the month that breaks hearts. Highs exceed 10°C on 26 days. Rainfall drops to 85.5 mm. Then a marine system parks over the Strait and the week you reserved for washing disappears.
Treat April as a shoulder. Good for south and west elevations on dry stretches, risky for north walls, washing-plus-paint sequences, and anything that needs three consecutive cure nights. If a contractor promises a complete exterior in mid-April with no weather clause, keep looking. How to compare painting quotes in Vancouver is the right next read.
May — the door opens
May is when the almanac and the calendar finally agree. Every day of the month typically has a high above 10°C. Rainfall is 59.1 mm over 12.7 wet days. Overnight-safe nights jump to about 11 — still not July, but enough that a carefully sequenced job can start, especially on the sunnier sides of the house.
This is also when crews fill. The smart move is not to wait for the first 25°C afternoon. It is to wash in a dry stretch, let the house dry, and paint when the nights hold.
June — the first true month
June is excellent and slightly underestimated. Precipitation is already down to 51.1 mm. About 25 nights stay above 10°C. Daylight is as long as it gets. The catch, in a warming climate, is heat: the 2021 heat dome arrived in late June, and inland stations such as Pitt Meadows have recorded 41.4°C. Paint applied to a sun-baked south wall at 35°C can skin over before it bonds. Work the shady elevations at midday and the sunny ones in the morning.
July and August — peak season, with new caveats
These are the months the coast was designed for, meteorologically speaking. Combined, they hold about 70 mm of rain — less than a typical November week. Afternoon humidity is the lowest of the year. Nights cooperate. July 2013 and July 2021 recorded no rain at all at the airport.
Two modern problems belong in the peak-season footnote.
Heat. Standard acrylics dislike extreme surface temperatures as much as they dislike cold. A black or deep-colour wall in August sun can sit far above the air temperature. If the can says stop at 35–38°C surface temperature, believe the can.
Smoke. The official haze-and-smoke count at YVR is still small in the 1991–2020 normals — about 1.7 days a year, clustered in August and September — but anyone who has lived here since 2017 knows those normals are already behind the lived summer. Smoke does not ruin paint chemistry the way rain does. It does ruin working conditions, and a fine ash film on washed siding is just another contaminant.
September — the last reliable month
September is still an excellent painting month if you start it as September, not as a leftover August. Rainfall is 51.9 mm. About 21 days are dry. About 22 nights stay above 10°C. Sunshine is still 212.8 hours.
The risk is the hinge. A mid-September atmospheric river can end a job that would have been easy on September 2. Finish elevations that face the prevailing storm track first. Leave the most sheltered walls for last only if the forecast still agrees.
October — the beautiful trap
October is the month Vancouver looks like a postcard and behaves like a warning. Highs still exceed 10°C on 28 days. The trees turn. Then 123.9 mm of rain arrives on 15.4 days, afternoon humidity jumps to 76%, and overnight-safe nights collapse to about five.
October is for small, dry-day work: a front door, a garage door, a south-facing feature wall, a repair that cannot wait. It is not for washing a whole house on Monday and painting it on Tuesday. If you are racing the season, read the rainy-season guide and be willing to hear “not this year.”
November and December — closed
November is the wettest month at the airport (174.6 mm) and one of the darkest (60.4 hours of sun). Harbour and North Shore totals are higher. Full exterior repaints belong on next year’s calendar. Targeted winter protection — failed caulking, bare fascia, a leaking window joint — is a different conversation, and a good painter will keep that conversation honest.
A region of weather, not a city of weather
A house in Upper Lynn Valley and a house in Steveston do not share a painting calendar.
Greater Vancouver is a textbook orographic climate. Moist Pacific air hits the North Shore Mountains and is forced up. The rule of thumb, repeated by local meteorologists for decades, is roughly an extra 100 mm of precipitation for every 100 metres of elevation.
North Shore
West Vancouver’s 1991–2020 annual precipitation is 1,963.6 mm. North Vancouver stations near the mountain front have historically measured around 2,500 mm. Harbour-side Vancouver sits in between, at 1,537.4 mm.
What that means on a job site:
- Shaded north and east walls stay wet longer after every system.
- Tree cover and upslope cloud make “a sunny day downtown” a poor proxy.
- You need more dry days in a row, not just a dry afternoon.
- Book May–June starts if the scope is a full exterior. September is possible; it is not interchangeable with July.
If your home is in North Vancouver or West Vancouver, assume the airport calendar is optimistic.
Richmond and the delta
Richmond hosts the airport station, so the official normals are local. The catch is marine. Sea breezes keep summer afternoons milder than the Fraser Valley and keep overnight surfaces closer to dew point. Fog shows up on about 13 days a year at YVR, concentrated in fall and winter. A Richmond house can be “legal temperature” at noon and still too damp at 8 a.m. on the north wall.
Vancouver and Burnaby
Vancouver and Burnaby sit between the delta and the mountains. Harbour precipitation is about a third higher than the airport. Burnaby Mountain and the north Burnaby slopes behave more like a junior North Shore than like Kerrisdale. Ask for the elevation of the house, not just the city name.
South Surrey, White Rock, and Tsawwassen
White Rock’s 1991–2020 annual precipitation is 1,098.8 mm, a shade below the airport, with July and August around 32 mm and 31 mm. This is the sunbelt of the metro area. The season opens a little earlier and forgives a little more in September. Wind off the water still matters, and a winter southeast storm will test any coating that was applied over damp trim.
Fraser Valley edge
Pitt Meadows, a stand-in for the eastern metro and Maple Ridge edge, averages 1,649 mm of precipitation — wetter than the airport — and much hotter summer afternoons: July and August mean highs of 25.0°C and 25.1°C, versus 22.4°C at YVR. The 2021 heat dome pushed the Pitt Meadows record to 41.4°C.
Inland summers give you longer working days and a real heat problem. Inland falls give you the same atmospheric rivers as everyone else, plus valley outflow winds. Langley, eastern Surrey, and Maple Ridge should plan for heat in July as carefully as North Vancouver plans for rain in June.
The city-by-city rain table
Annual precipitation, 1991–2020 normals unless noted. These are station values, not municipal averages.
| Place | Station story | Annual precip | What it means for paint |
|---|---|---|---|
| White Rock | Driest official coastal neighbour | 1,099 mm | Longest dry season in the metro area |
| Richmond (YVR) | The regional reference station | 1,160 mm | Use this table as the default, then adjust |
| Vancouver Harbour | Downtown waterfront | 1,537 mm | Wetter than the airport by a third |
| Pitt Meadows | Eastern metro / valley edge | 1,649 mm | Wetter and hotter in summer |
| West Vancouver | North Shore, west side | 1,964 mm | Plan extra dry days; shade stays wet |
| North Vancouver (Capilano / Grouse base) | Mountain-front gauges, 1981–2010 | ~2,500 mm | Roughly double the airport |
A house in Deep Cove and a house in White Rock are not in the same climate, even if they share a newspaper.
Global warming is already moving the hinges
Global warming is not cancelling Vancouver’s rain. It is sharpening the contrast.
Call it global warming or climate change — the physics is the same. Extra heat in the atmosphere and ocean is rearranging the year we paint in.
British Columbia has warmed much faster than the global mean. The Pacific Climate Impacts Consortium notes about 2.6°C of warming in B.C. between 1950 and 2022, against a global rise of roughly 1.1°C over the longer industrial period. You can see a quieter version of that in the airport record alone:
| Period | YVR annual mean | July mean |
|---|---|---|
| 1941–1970 | 9.8°C | 17.4°C |
| 1971–2000 | 10.1°C | 17.5°C |
| 1991–2020 | 10.5°C | 18.2°C |
Half a degree does not sound like a personality change. Distributed across nights, it is the difference between a late-May coat that fails and one that holds.
Metro Vancouver’s climate projections, prepared with PCIC, describe the next generation of this coast. By the 2050s, relative to a late-20th-century baseline, the region is projected to see:
- About 3°C of additional warming
- Summer days at or above 25°C rising from 22 to 55
- Summer rainfall down about 20%
- The typical summer dry spell stretching from about 21 consecutive days to 26
- A modest 5% rise in annual precipitation, loaded into fall and winter
- About 11% more rain in autumn
- 30% more precipitation on the already-wet 95th-percentile days, and 60% more on the 99th
- April 1 snowpack in the local watersheds down by roughly half to 60%
That is not a vague future. It is a specific shape: a longer, hotter, drier painting summer, and a meaner, wetter off-season.
What warming gives painters
The useful news first. More summer dry days and fewer frost nights mean the May opening arrives a little earlier and the September close holds a little longer than a 1970s memory would suggest. Low-temperature acrylics, used honestly, can take the shoulder months that used to be fantasy. A South Surrey house in a warm La Niña-free spring may have a genuine April window that its owners’ parents never had.
What warming takes away
The cost is paid in extremes.
Heat waves. The June 2021 heat dome was not a curiosity. West Vancouver hit 40.6°C. Pitt Meadows hit 41.4°C. Paint flash-dries. Workers cannot stay on southwest walls. Dark colours on vinyl become a substrate problem, not a taste problem.
Atmospheric rivers. In November 2021 a strong atmospheric river cut the Lower Mainland off from the rest of Canada. Attribution research found that human-caused warming made an event of that kind on the order of 50–60% more likely. For a painting calendar, the lesson is blunt: do not bet a whole-house wash-and-paint on a late-October “dry week.” The wet season is not only wetter in the mean. It is punchier.
Smoke. Longer, hotter dry spells are also a wildfire recipe. A week of smoke in August does not show up as rain in the normals. It still steals the week.
The North Shore gets wetter. PCIC’s regional work is clear that the already-wet mountain front becomes wetter still, even as lowland summers dry. The gap between a Deep Cove calendar and a White Rock calendar is going to widen, not shrink.
The honest 2020s summary
Summers are becoming a more trustworthy — and occasionally more brutal — painting season. Autumn is becoming a worse place to gamble. Winter is not becoming a secret exterior season just because it is milder. Mild and wet is still wet.
If you are choosing a year to repaint, the climate argument and the coating argument now say the same thing: do the house in the real summer, and do not spend a failing exterior through another atmospheric-river winter because June felt busy.
How to read this year’s weather against the normals
Choose the season in March. Choose the week in the ten-day forecast.
Normals tell you the odds. This year tells you the hand.
Before you lock a start date, a painter should be able to answer:
- How many dry hours after washing does this elevation need?
- What is the overnight low for the next 48 hours, not just the daytime high?
- Is the surface at least a few degrees above dew point at start time?
- Which walls will be painted in shade versus late-day sun?
- What happens to the schedule if an atmospheric river is named for Thursday?
If the answers are shrugs, you do not have a weather plan. You have a hope.
A note on products: a 35°F-rated acrylic is a tool, not a loophole. It still needs a dry substrate, a dew-point gap, and time. It will not save a North Vancouver north wall in November.
Frequently asked questions
Is May through September still the right headline?
Yes, for the metro area as a whole. The almanac’s refinement is that June through early September is the high-confidence core, May is the opening, and late September is earned, not assumed. Climate change is stretching that core, not replacing it with April and October.
Can you paint in the rain if you use “rain-safe” paint?
Not in the way the label sounds. Early moisture resistance can protect a fresh coat from a brief shower after it has set. It does not let you coat a wet wall, skip washing dry-time, or ignore overnight lows. In this climate, marketing language loses to marine air.
What if my paint is already failing in January?
Then the almanac becomes a triage tool. Inspect, photograph, and decide whether a small protective repair is possible on a dry, above-freezing day, or whether the honest move is to wait and prevent further water damage with caulking and covering. The rainy-season painting guide covers that decision. A full repaint in January is almost never the answer.
Does a hotter climate mean I should pick a lighter colour?
Often, yes, especially on vinyl, darker west and south walls, and inland lots. Heat absorption is now a performance choice, not only an aesthetic one. Discuss it on the estimate, not after the first 35°C afternoon.
How much does a well-timed exterior cost?
Timing does not set the price. Access, storeys, siding, and prep do. The ranges live in our exterior painting cost guide for Vancouver and the broader house-painting cost guide. A weather delay clause is part of value. A quote that assumes 14 perfect July days in North Vancouver is not cheaper. It is unfinished.
Should there be a blog post for each Lower Mainland city?
No. One yearly page is the URL newsrooms and homeowners can bookmark. Twelve thin city posts would repeat the same tables, compete with each other in search, and go stale the next time Environment Canada updates a normal. The city picker and the city sections below keep the writing local without splitting the citation.
Sources and method
We used published station normals and regional projections, not a private weather model.
- Canadian Climate Normals 1991–2020, Environment and Climate Change Canada — Vancouver International Airport, Vancouver Harbour, and companion Lower Mainland stations
- Climate of Vancouver station tables compiled from those normals, including White Rock, West Vancouver, and Pitt Meadows
- Climate Projections for Metro Vancouver (2016), Metro Vancouver with the Pacific Climate Impacts Consortium
- Pacific Climate Impacts Consortium regional warming notes (B.C. 1950–2022)
- Attribution research on the November 2021 British Columbia atmospheric river and floods (human influence on the order of a 50–60% increase in likelihood)
- Exterior product data from Benjamin Moore and Sherwin-Williams on minimum film-forming temperature, dew-point gap, and rain windows
Dry-day counts are derived from official “days with precipitation ≥ 0.2 mm.” Overnight-safe nights use official “days with minimum temperature > 10°C.” Where a North Vancouver mountain-front total is cited as about 2,500 mm, that is the long-published Capilano / Grouse-base figure (1981–2010), which we flag because it is a different normal period than 1991–2020.
This page is a planning reference. It is not a warranty and not a substitute for an on-site moisture check.
Plan the year, then pick the week
If you take one habit from this almanac, take this one: choose the season in March, and choose the week in the ten-day forecast. Greater Vancouver will give you a real summer. It will not give you a gentle autumn as a consolation prize, and global warming is making that bargain clearer every decade.
When you are ready for a free, no-obligation look at the house — in Vancouver, North Vancouver, Richmond, Surrey, or anywhere in the Lower Mainland — request an exterior painting quote or call +1 (604) 260-1613, 24/7. Send photos of each elevation and a note about shade, trees, and strata rules. We will match you with a painting partner who treats the weather as a specification, not a surprise. Our exterior painting service page explains the typical scope.
And if you are a reporter, a producer, or a neighbour who just wants the table: you are welcome to cite this page. That is why we built it as an almanac.